Friday, December 16, 2011

Wedge: FAILED... (badly)

Well, this is the problem with TA and chart formations. They help you see a picture that MAY develop but doesn't necessarily HAVE to. The wedge was in play till it wasn't. This is why you don't buy in anticipation of a chart break-out, you buy the break-out. Otherwise, you risk being long and seeing what just happened occur, and that stings. So lets go over the chart. First the daily. As you can see, we stopped at our all important 150 day MA a few days ago and held it for the close. This MA has marked EVERY MAJOR BOTTOM IN THE LAST 3 YEARS!!! Of course it's failure to hold is certainly not a good thing, the fact that it continued downward and pierced right through the 200 day MA as well is even worse.


OK so that is the daily picture.  Unfortunately, the weekly doesn't look much better.  We can see from this a similar picture on a different scale. Doesn't look pretty.


Finally I will give you the monthly to look at, which kinda puts things more in perspective for the "big picture".  Although the daily and weekly look bad the overall trend is still intact for the monthly.  The only thing that concerns me is the MACD which took a sharp turn down and looks like it could crossover.  Something to keep an eye on because it could spell out a 2008 style decline.


Anyway, putting everything in perspective, we come up with the following conclusions...

-Europe is screwed.  Any way you cut it, Greece gets kicked out, Germany leaves, the Euro splits into 2 different Euros, they suck it up and print money or they collectively default, it doesn't matter, the end result is the same=good for gold.

-We are next.  The term "cleanest shirt in the laundry basket" has become popular.  It's more like "least smelly public bathroom in Newark NJ."  Make no mistake, those that are attacking Italy sending 10 year yields to beyond 7% will do the same for us when our time comes.

-The thing about printing money is this: once one country does it, others have to follow to maintain competitiveness.  Britain has joined the party, Japan has been active in it as well.  The Swiss have stated they will and upon such news as everyone shifted attention to investing in Norway, the Norwegians said in very plain terms "don't even think about it."  Australia who is doing far better than any other western nation, has been lowering interest rates to preplan for a Europe disaster.  We, the USA I mean, are the most notorious for printing money, and Europe, Germany be damned, will have no choice but to join in or risk an overall Euro default.  It's a world wide race to see who can send our currencies to ZERO the fastest.  Try and argue a point for me that proves that is not insanely bullish for gold... seriously, just try, I'd love to see it, I haven't laughed in a while.

All of this leads to conclusions that are wildly bullish for gold, which I might add, is for whatever reason, very much on sale.  This is NOT the type of market you can try and chase momentum and price action in.  This is a very simple "buy the dips, sell the rallies" type game.  (and if I may add to that, "buy the dips, sell the rallies, and try to hold down your lunch in the mean time".)  you have to buy VALUE, plain and simple.  I will leave you with a quote from my grandfather when asked "how to make money in the market".  His reply, "Buy a $20 stock for $10."  That is value, and that is smart investing.  Buy a $2000 oz for $1550.  That is value and smart investing.

Till next time my friends,  stay strong, and be careful out there.  It's a Madhouse.
-J

Tuesday, December 6, 2011

Brief comments on today's action

Ok briefly here, today's action in gold was important even though not substantial.  A move lower was definitively rejected at both a support point as well as the 50 day MA.  The fact we did not quite get to the low range of our wedge, as well as hold lows at 1700 or below for long periods, screams of value buying coming in.  MACD was set for a nice bullish crossover.  If you pay attention, you've probably seen enough times with gold that that happens only to fail and roll right over... as if by magic...  the resilient move today will most likely foil those plans of the powers that be.  It looks from here as if we will definitely make a stab at 1750 again, provided we can maintain above 1720 area for a bit.  If we bust through that region, 1800 is a given, which should be propelled easily after the break of the wedge formation.

Just remember from a trading aspect, don't buy in an anticipation of a chart formation break out, it might not pan out.  Buy the break out and sell soon then wait for a pullback to buy again, if your looking for a trade.  Especially in the case of wedges, as a friend restated to me the other day, 90% of the time in my experience, a wedge formation that reaches its apex without a significant move one way or another, will most likely eventually break down.  Remember "what can't go up, must go down and vice versa".

Regardless, lets say this, I suspected we wouldn't see gold start making a move till late nov.  its now early dec and we are at least showing promise.  if we break out buy years end a rally could last on gold for 2-3 months, and show us an easy say, 2100.  HUI, that could be 650+.  Point is, my original gut, fundamentals, and technicals are coming together at the same time, and thats usually served me well... make you own assessment.  below is the chart. 


And remember, be careful out in that financial world, it's scary.

-J

Monday, September 5, 2011

GOLD STOCKS (finally) BREAKOUT!

Wow!  And it's about damn time too!  I just wanted to take some time this extended weekend and analyze a few of the miners specifically that we might want to use to play this breakout going into next week.

Let's start with the overall sector.  This is the HUI punching through tough resistance at the previous all time high.  If you are not familiar, the HUI is called the gold "bugs" index, "bugs" standing for "Basket of Unhedged Gold Stocks."  It consists of the major and intermediate producers, such as GG (which I believe is the highest weighted stock on the index) ABX, NEM,  IAG, AUY, etc...  The majors seem to have really made a stand recently.  Most likely due to constant divided increases in an uncertain market.  Now that it has cleanly broken above resistance at 610, I'm eyeing a target of 750-800 in the next few months.  That may sound like a lot, but an 800 target is only a 30% gain, and if you've ever seen gold stocks when they decided they want to move, you'll know that you can make a good chunk of that 30% in just 1 day.


Next, we have Fortuna silver FVITF.  (Or FVI.TO for you Canadians.) After 5 months of developing a cup and handle formation, Friday's close was the high of the day pushing it barely through the break out point on good volume.  It looks guaranteed to run to 7 from here, though it may pull back a few times in its move higher, the chart suggests a target of $8.50... My analysis on the company suggests higher than that, especially if we see higher silver prices going into years end.  I don't think 12 is an outlandish target price for the coming year. Let's take a min to look at some other aspects of the company.  They have a major mine in mexico opening this month, and they just filed for the NYSE.  They're costs at this new mine will be in line with industry standards at about $8/oz, but coupled with their existing mine that produces for -$4, you've got about 6.5 million oz's produced in 2012 at $6/oz... 130 million shares outstanding.  They will be making some serious profit.

Next we have a tried and tested solid company I have liked for quite a while, First Majestic Silver.  (AG or FR.TO)  The setup is identical to FVITF, except AG hasn't quite gotten passed it's break out level 25-26 yet.   Buy when it does make a clean break through.  A target of 32-35 is reasonable and likely.  With production increasing to 8 million oz's this year and 10 million in 2012, while costs remain near $8/oz and talks of a dividend in a few months, the fundamentals behind this company certainly support such a move higher.

Great Panther Silver, (GPL or GPR.TO)  looks ready for a move.  It might only be a modest move higher to about $4, but if it can clear above that, $5 seems likely.  Major wedge formation is tightening and a break is imminent.  If it clears around the $3.50 level on good volume, It will at least try for $4. 

Ok, I know.  The title is "GOLD STOCKS (finally) BREAKOUT" and I'll I've done is mention silver companies.  They seem to be leading not just the metal, but the gold stocks which will follow very soon.  So here is GG.  Support has held at 46, while resistance has held it back at 56.  This long consolidation pattern gives it a target near 65 by years end and I think that is reasonable. 

Now NEM,  which for years has been everyone's least favorite gold stock.  It is butting up against resistance at the all time high of 65.  Although a touch extended, it looks like it wants to go through, although a pullback to the $60-58 area wouldn't be a surprise.  If it were to clear,  it could go to around $70-80.  Let's say $75 by years end for good measure.  This one is more than backed up by the fundamentals.  The current PE is 13.5, the dividend yield is near 2%  (and will be drastically rising soon, as the board of NEM spelled out that the dividend will be raised to $1.60 at gold 1700-1799.  Based on their chart of 20 cent increases for every $100 increase in gold, and that we are now 1900+, we should expect $2/share in the near future). 

Well, that's the main ones I wanted to discuss.  There are plenty more I like a lot but, they have already made a move higher, or don't have exciting charts to post, but I will leave a brief description on each.

1.  NGD- Moving nicely higher and I expect that to continue.  Buy on a pullback to support near $11.50.   A $15 target on this is more than conservative. 

2.  IAG- If they can clear the 22-23 level It should try for near 25-28.

3. RGLD-  The royalty model is king, and RGLD is showing us that.  Nice break out.  Support is near 67-70 area, and stronger support near 62.50, but I wouldn't hold my breath waiting for it to go that low.

4.  FNNVF- Again, royalty rules. Breaking out from a small consolidation, it could move near 48 or so.  Support is around 42, and 40. They also should be moving to NYSE this month.

5. UXG- Chart looks terrible but support at 5.50 has been tested and held strong multiple times.  I wouldn't make a huge bet with this one now, but I guarantee whatever McEwen is doing regarding the merger of US gold and Minera Andes is gonna be big so pay attention to any news.

6. SNDXF-  Again, on royalty.  This company has some royalties on small miners.  Just moved cash flow positive.  Chart looks great.  Not a bad one to pick up some shares of at  less than $1.50 a piece. 

7. AUNFF- Aurcana is a monster silver miner cleverly disguised as a penny stock.  There is just too much to say, so I will post the company profile here.  Look this over for yourself, and try and tell me with a straight face this is not worth MUCH more than the 70 cents it is selling for.

OK EVERYBODY!  THIS IS GONNA BE A FUN FALL AGAIN FOR PM INVESTORS! Remember please to do your own due diligence, I have been wrong once or twice ya know.  Good luck out there and happy trading!

-Jonathan M. Mergott

*Full disclosure*- I myself, and/or clients I work for own every one of the stocks mentioned above.  I do not however, work for any of the companies, or collect special payments from them in compensation for my writing about them.  I make money the same way all shareholders do, share appreciation and dividends. 

Monday, August 15, 2011

It's all about the Benjamins...

...Or Aussies, Swissies, Euros, Yen, Loonies, etc.  Yeah, yeah, the stock market plummeted last week.  It's irrelevant.  All eyes are on the currency market.  If your's aren't, they should be, because what happens with the currencies affects every other asset class, be it commodities, bonds or stocks in every country around the world.  Of course, the two currencies most looked at by traders are the Euro and the Dollar.  The Dollar has by some grace of God, managed to stay range bound between 73.50 and 76 for the last few months on the USDX.  The Euro has also done very little, and being that it is nearly 50% of the dollar index, explains why the USDX has managed to NOT crash yet.  But if that's all you are going on, you are missing WAY too much.

The other currency that is weighted the 2nd most on the USDX is the Yen, which despite Japanese government intervention to keep it from appreciating too much after such a devastating disaster like they've had, has mostly fallen on deaf ears as far as the currency market is concerned.  The USD/YEN is now trading at 76.75 currently and that is the dollar's lowest level against the yen since as far back as any of the charts I have will go. (Which is 1976 for the record.)  Despite a less than desirable economic situation in Japan that has been on going for a very long time, traders have still taken this to be a "safe haven" currency when compared with a currency that is now obviously beginning a downward spiral into hyperinflation.  From a trading standpoint, buying the yen at a test of the 200 day MA has been a strategy that has been quite profitable for almost 4 years now.

The next currency I wanted to mention is that of our northern neighbors.  (If you're Canadian and you are reading this I mean you, there is no need to look more north.  I do not believe the North pole has a currency, but if they do I am certain it is rapidly appreciating against the USD as well.)   The USD put in an all time low against the Loonie back in 2008 at 90 cents.  It is currently 98 cents, and at all attempts by the USD to rise against it, have been kept from getting above par for almost all of this year.  Let's keep in mind, this is from a high hit in 2002 of about 1.62.  In other words, the USD has lost almost half of it's value against the Loonie.  Now, here is an example of a country that lost it's AAA rating, balanced it's budget, and regained it again.  They also have a much lower business tax rate than us.  Well, If they can do it why can't we?  I suppose somewhere in the 5th dimension of planet X it may be possible to cut a 1.6 trillion dollar deficit and pay back a 14 trillion dollar debt without causing a catastrophe of epic proportions, but lets also not forget the cardinal difference in the two dollars; The Canadian dollar is backed by and exchangeable for silver, The US dollar backed by...nothing.  Unless you put a lot of faith into the promise of the US government and the Bernank.  By that standard I have a hard time understanding why the USD is as high as it is VS the Canadian.


The next one I want to discuss is the Aussie.  Which I am particularly fond for many reasons.   Being a commodity country it should be no surprise that this currency has been moving higher against the USD.  In fact, the Aussie DID reach a high of 10% higher than the USD.  The growth story is China.  Australia has the materials they want and need, and they are only a hop, skip and a jump away.  Australia maybe for that reason the only "western economy" that makes it out of this mess alive.  If you couple in some beautiful scenery, and warm weather, It shouldn't be a surprise to anyone who knows me that Australia is where I plan to retire in while the SHTF (as well as Kangaroos.  In NYC, you have to deal with rats, eww.  In NJ where I live, you have to deal with deer, which are essentially big rats except I never knew anyone who ever totaled their car from hitting a rat.  At least in Australia their local wildlife hops around in a very amusing manner, and if your in the right place at the right time, you can catch a free boxing match.  I've never seen a rat do that before.)


Finally, lets look at the Swiss Franc, which has gotten a lot of attention recently.  The Franc, which is also at a more than 30 year high against the dollar (again that's as far back as my charts can track it), has been intervened by the Swiss central bank as well do to it's rapid ascent against the USD.  (They're very concerned about their ability to sell those nifty little knives over seas.)  All intervention on their part was wasted effort, as traders quickly reversed it's move and continued it's rise.  The recent news of possibly linking the Franc to the Euro did however scare traders and the dollar was able to make an ever so slight 'pop' against it's waterfall like move downward.  The legality of this is up for debate.  The logic of this is not however.  If you ask me, that comment was simply an "ends justify the means" scenario.  Why the Swiss, or anyone else for that matter would want their currency linked to the Euro is beyond me but for the time being, they got their wish and the Franc pulled back a touch.  All in all, it remains a better place to hold money than USD and will most likely continue to be, and continue to follow gold higher.


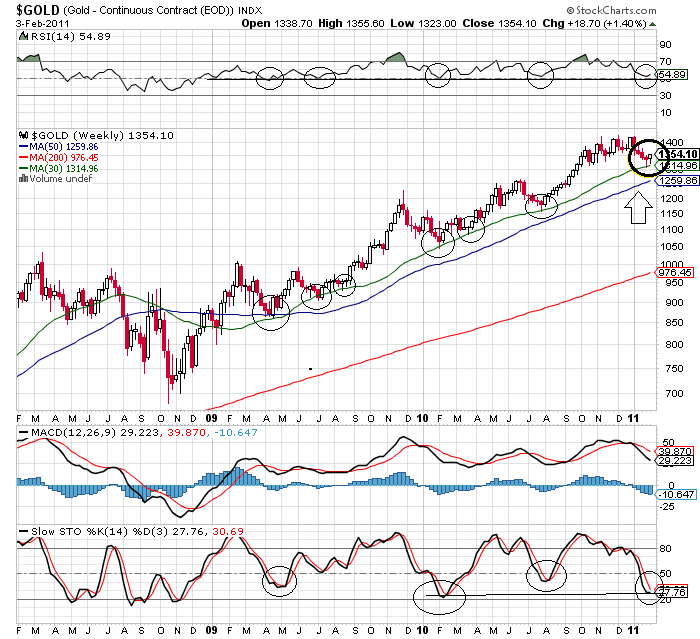
Wait, you didn't think I was going to write an article about currencies and NOT discuss the ultimate currency did you?  What can I say about gold?  Hmmm... I guess, hold on.  After rises like the one gold has you can often find yourself in an odd predicament.  On the one side, it's gone up a LOT in a relatively short time frame, so you may be tempted to take some profits there.  On the other, a massive rise like this shows just how much strength this market has and going against the trend can prove to be very unwise.  So what should you do?  Simple, I'll tell you exactly what I am doing.  Hold onto the gold you own, taking profits on leveraged positions is common sense after this run, but don't sell what you rightfully own outright.  As Jim Sinclair said a few days ago, "taking profits on bullion and rolling into good gold shares now is just common sense."  There is a lot of great growing companies out there, and a few that are now paying decent dividends as well, but remember PROFITS!  Don't go and sell all your gold for miners or vice versa.  A good formula has been to have a good amount of both.  The miners do outperform the metal when things are going their way, but when the market moves down 600 points and gold moves up $50, having all you money in miners is a losing day for you.  Bullion hedges your stock market risk, miners offer company growth, massive profit margins and dividends, which is the biggest argument for why bears say not to own gold, because it can't pay a dividend, well the right miners can.  (Granted, those same people will turn around and tell you to sell all your worthless gold and buy Apple, which also does not pay a dividend, but whatever.  Just wanted to point that out.)


Ok, that's all folks.  Remember to keep your hands in the vehicle, leave your seat belt attached at all times and don't forget, this ride has been known to inducing vomiting.  Good luck out there!

-Jonathan M. Mergott

Monday, July 11, 2011

A quick note on today's action

A quick note on today's action.  This intraday reversal we are seeing in gold is very similar to what we saw on June 21, when it tested this tough resistance at 1550 and reversed as well.  What followed was a nasty sell off. I continue to harp about a needed test of the 150 day/30 week MA that has yet to come. If I am right about this, we could stand to lose $100/oz in 3-4 weeks or less. To believe a rally in gold that gained about $75 in the course of 6 days in July of all things is enough to make me more than skeptical. If you played this rally, which I did not, I would suggest taking your trading profits now.  If you have a leveraged position, I suggest clearing it up.  A good play on gold rather than risking a short position in the metal itself (highly inadvisable in this world of anything-can-happen-at-anytime.) Or a short position on miners (more than just inadvisable, portfolio suicide if you ask me.  any one of them could be bought out at anytime.) would be to buy puts.  For instance, Aug puts on the GLD at a strike of 140 (which coincides with gold's 150 day MA) are very cheap.  Rolling some profit over into them at currently 35 cents is not a bad way to have a low risk/potentially very profitable position on declining gold, but is also a way to make the next month of this market not be a complete waste of time.  In closing, it's summer.  We know what that means for gold, lets not think it will be different this year.  Cash out some trading positions, use the profit to take a vacation, go to the beach, go fishing etc.  But in the course of doing so, try to resist the urge to check kitco everyday or it might just ruin your vacation!

Saturday, June 25, 2011

A rose by any other name..


Happy Weekend! After the last few weeks even someone like me who loves what they do is happy to see the weekend! I wanted to start off this week and talk about some of the recent headlines before moving onto our technical analysis on the markets. It's been an interesting couple of weeks. Let's start by discussing the many angles of this move to tap the Strategic Petroleum Reserve. This move has gotten a lot of flack from just about everybody, as well it should. A 30 million barrel release of a commodity we hold so dear to us, is stupid from an investment aspect, but it is also completely inefficient. According to the US energy information administration, the USA consumes about 20 million barrels of oil a day. So that means they have released enough oil to run this country for a whopping 36 hours. In comparison, 11 million barrels were released after hurricane Katrina, and 21 million were released after desert storm. If any of this makes sense to you please contact me and explain, because I'm either too stupid, or too logical to make sense of this on my own.

Whether this was a ploy to bring down gas prices as Obama sets his sights on reelection, as some have stated is beside the point. The only way I'm looking at this, is from the view point of the fed. If you've been around the gold game for more than 5 min, you know the dirty tricks that get pulled on us. You also know the massive moves gold is capable of making to the upside. That's because they are "allowing" us to run. The powers that be know better than to stand in front of the gold market when it's breaking out, so they don't. Instead, they take every opportunity when there is some weakness to slam things even more and make us bleed. Which of course, causes more weakness and fear in the market and it continues to feed upon itself. All they need to do is get some momentum rolling and sit back and watch the chain reaction take effect. This is what they are doing with oil now. Now that it has already dropped from 114 to 90, they are REALLY trying to put the screws to the market to make everyone think its going back to 75. It won't. This all kinda ties into the fed statement, in which in response to a possible QE3 the bernank said "The fed stands ready to act in the event we need to." Translation: If we get a deflation scare, which we are creating purposely by saying this in order to bring commodity prices down hard and fast, we will print money. Now, as consumers, you and I know that gas is about $3.75 a gallon now, down from $4 a few weeks ago. (I live in NJ so I'm quoting what its cost me recently.) This is up from much less only a year ago, so is there inflation? Of course, we know that based on our daily lives, but that is not how the fed knows that. They only know it from looking at CPI. Gas prices are still high, but if by saying there is not going to be a QE3 "At this time" and releasing 30 million barrels of oil we can violently bring down gas prices, guess what CPI is going to look like next month? Down sharply, and that's all they wanted. If you didn't watch the speech the bernank gave 2 weeks ago, do not fret, I can sum it up in a one sentence quote of his; "Interest rates are likely to quickly rise." He speaks in such a way to say 2 different things to 2 separate audiences while only having to say 1 sentence. By saying that, he has now scared the politicians enough so that when he DOES do QE3, they will not question his actions, while simultaneously saying to the markets, "Calm down, I will be there to support you." Rather brilliant, I must say. So long of course as your wearing you fed ear filters to translate the BS.

There are 4 main things that the fed pays attention to: GDP, unemployment, inflation and interest rates. GDP is going down, unemployment is going up, inflation is rising, but luckily interest rates are still low. So they are 1 for 4 now. The biggest tool the fed has is talk. They can't talk up GDP, nor can they talk down unemployment. They can have an effect on interest rates, and by denying another round of QE, they are in a sense talking down inflation by giving a deflation scare. I think it is important to remember where we sat when QE2 was announced. Oil was $85/barrel. Now, we sit at $90. Almost enough to feel comfortable pumping up the economy again. I have said before money is a drug far worse than crack or heroin and the market is feeling the withdrawal symptoms now. I liken it to a child in the supermarket screaming at 110 decibels "I WANT CANDY"! The question is, will the child's mother (Bernanke) give into the child (the markets) and give them the candy, or deal with the splitting migraine that ensues? There is not much time left till Christmas when you think about it. Do you think with all the sliding economic numbers recently that the fed will send the consumer out to carry the holiday season on their own? Further stimulus will be given before hand one way or another. They may not call it QE3, but a rose by any other name will still make our currency smell like shit. Here is a thought to ponder; The avg rate of the 2yr, 10yr and 30yr is 2.5%. The treasuries on the fed's balance sheet totals 2.6 trillion dollars. 2.5% of 2.6 trillion is a return of 62.5 billion dollars a year. (Hey maybe treasuries aren't the worst investment if you got 13 digits!) With some clever wording, they can easily implement the purchasing of additional treasuries based on the yield of the current ones (Dividend reinvest essentially). Which of course grows the balance sheet making next years yield even more etc, etc. There are ways they can do this beyond the obvious is all I am saying. And it will be done, sooner than later.

Now that I've written more than I intended to on those subjects, lets move on to the markets. The first chart is gold. (actually, it's the GLD which I am only using because stockcharts for some reason does not provide the option any more to switch to candlestick charts on the daily commodities. The chart is GLD but I will be quoting prices in terms of Gold.) The picture that is unfolding looks very similar to what we saw occurring 6 months ago at the low 1400 level. The first thing to notice, is that we consolidated unable to break above 1440 for 3 months. MACD in that time began trending lower as price consolidated until finally, we broke below the 50 day MA and fell $50 from that point. Today, we have spent a little more than 2 months consolidating above 1500 and have been unsuccessful in breaking above 1550 again. MACD is trending lower, and a buy signal we almost got from it, was quickly reversed. The clincher, was Friday's action where we broke below, and closed the day AND week below the 50 day MA. (Also, I want to point out that on the weekly chart MACD has turned below the MA and is heading lower too, so the daily looks like a sell, and the longer term chart confirms the same. I didn't want to have to post another chart just for that one footnote.) So it looks as if summertime blues for gold will be back this year. Now, if you have ever read anything I've written you know how much I harp on the fact that gold in the last 2 1/2 yrs has found a bottom on every major decline PRECISELY at the 30 week MA (or the 150 day MA) This, despite everyone's calls for a test of the 200 day. It hasn't done it in over 2 years. The trend is our friend, go with it. Consequently, the 30 week MA rests nicely at 1440, which we know from our major consolidation 6 months ago that the 1440 level will now act as major support, so this should be a level we buy strongly at when it occurs. Being that in fact, a broken clock IS right twice a day lets assume we finally get that test of the 200 everyone will be screaming for. The 200 day is sitting about a whopping $25 below the 30 week still in that major support area. I don't know about you, but If I buy strongly at a test of the 30 week, which I intend to, and gold slips another $25 lower to test the 200 before resuming its climb, I can assure you I won't lose any sleep over it. So to sum up the gold picture, look for an attempt to retake the 50 day sometime next week, which from where I sit, will most likely result in a failure. Expect gold to test the 30 week and bottom around 1440-1460 by mid-late July, and be a strong buyer at that time. Our customary fall rally will take place again, just as our summertime blues has. I am eyeing near 1750 by year end.
Now the next chart is weekly silver which I am only going to discuss briefly as their isn’t much going on here anyway. To go back to my point on gold testing and never breaking below the 30 week MA, we can see that it is at that EXACT level (as shown by the green line) where silver has found support after it’s decline. What does it mean? Will silver now begin a more modest climb as gold has had? Will it consolidate above this level until it has another parabolic explosion? I’m not sure but it is rather interesting. One thing I am sure of, is that at these levels the miners a stacking piles of cash. With the majority of the silver industry able to mine silver for about $8/oz, levels over $30 will result in earnings power that I do not believe the market is taking into consideration nearly enough. Earnings on some of these smaller growing miners could rocket so much so quickly, that the market finds them suddenly selling for 8x earnings. The larger miners, will see such increased cash flow, they will be able to do acquisitions, share buy backs (as we saw Silvercorp announce) and possibly most important, DIVIDENDS! So the thing that I see when looking at the Silver chart, is simply sustained levels at 100% higher than 1 year ago. That’s the point when I stop looking at the chart of the commodity, and start looking at the chart of the miners.

Well, while we're on the topic of miners, this brings us to our next two charts; the GDX and the GDXJ. To say the miners' performance has been disappointing is an understatement. If you own miners and your feeling some pain, your misery has plenty of company, believe me. Myself included on that. Frankly, the level some of these guys are trading at is inconceivably idiotic if you ask me. Some of their PEs have fallen to levels that just don't make sense to any rational human. The market has been down on them, and even the gold community has jumped ship recently. This is fine by me, as we all know from a contrarian aspect what happens, when everyone runs to one side of the boat all at once. The boat flips. That's the good news.  Any shorts that haven't covered are just greedy and will ultimately be slaughtered like the pigs they are. We all know the fundamentals always win out when a market is acting irrational like this one currently is, so just hold on. In the fall of 2009, gold finally broke $1000 and its been racing higher ever since. In the fall of 2010, silver had it's break out and has performed unbelievably well, and still holds much higher than it was before the break out. I believe, that fall 2011 will be the miners time to shine and could make gains from that point on, that make the break outs of gold and silver look like minor "pops". The juniors will outperform, the majors will buy them, have increasing reserves and cash flow that will ultimately result in higher dividends. As we look at the charts for the GDX and the GDXJ, I want you to keep one thing in mind; I expect the two to one day trade at par somewhere near the $75 level. This very well could be accomplished by years end.
                  
This final poor excuse for a chart, is of the S&P 500. The action has been rather telling and what it does say, it's saying quite loudly. Since breaking below 1300, rallies have not been able to get back above that key level even briefly. So far the 200 day MA has held, but I fear after one more attempt to climb over 1300 and/or retake the 50 day MA, failing to do so will probably result in a failure at the 200 day MA as well. I believe we can easily see a repeat of what we saw the summer of last year and the S&P could consolidate in that "W" formation. If it were to not hold here, the next area of support is the top range of last years consolidation in the 1220-1200 region. This is what I anticipate to occur. Look as we go into next week for an attempt for 1300 and/or the 50 day. If we were to break under the 200 day, we could have a long and fast decline before we find any buying support.

Well, I think that will do it for today. In closing I want to say remember the fundamentals behind what you're doing and why they are right. Charts are a great tool but don't get too hung up on them. In the mean time, as we go into what looks to be a rocky summer for all markets, keep your leverage low and your patience high. It will pay off. If you want to trade, build a nice cash position and develop a wish list of things you want to buy going into the fall. Christmas will come early for gold investors.
-JM

Tuesday, May 17, 2011

Ok, so now what?

Wow! What a run we've had since my last writing! Gold bottomed at 1309 precisely at it's 30 week MA (again) and proceeded to climb all the way to 1575, a gain of over 20% in 3 months! Silver rocketed from a low of 26 to nearly double that in the same time frame! Let's not get me started on some of the silver miners that gained over 100%!

Ok, so now what? Gold is currently trading $100 from it's new all time high, the HUI has retraced nearly 100% of everything it gained since the rally began, and the "silver bubble" has "officially" burst according to the "experts" (By "bubble" I mean delusions by the same folks who fueled the NASDAQ and housing market bubbles, and had never even heard the phrase before. By, "officially" I mean I am simply repeating what ever Mark Haines from CNBC says. You know, the guy who was quoted saying "Looks like time to sell your stocks" when the Dow hit 1300? The 65 year old, now-of-retirement-age guy who has worked as a financial news anchor his entire life but apparently has made so little money in the actual practice of it he still needs to have his day job? And by "experts" I of course mean the investment banking institutions personal silver mining analysts, despite the fact that the banking institutions didn't even have GOLD mining analysts until about 2008, but now they have silver mining analysts... well, had I suppose, they appeared for about 4 weeks somewhere around $32/oz, and have since been fired after the crash from $50.) But I digress...

I have often had arguments about chart formations that have formed in gold over the years with colleagues. Ultimately, it was a fruitless effort as in practice, one man's inverse head and shoulders can easily be interpreted as another's cup and handle. The psychology behind both of them are almost identical, and the projected break out targets are as well, so lets take a min to look at some of the past formations gold has given us.


Most recently we have the consolidation that took place for most of last year, before breaking out in the fall. As can be seen on the chart, that formation could easily be taken either way, but the end result was the same. Similarly, the 18 month consolidation we had from 2008-2009 (or as I like to call it, "the battle for $1000) can be seen as having an almost identical formation as the consolidation last year (just on a larger scale). Gold has shown us that it likes to do that. With that information now known, a similar formation should be looked for as we go into our typical "exciting" summer months. (You did catch the sarcasm there, right?) Combined with other truths gold has spoken to us in the course of it's bull run, we can almost expect such a formation to occur, bottom sometime in July at it's 30 week MA and then have a breakout to new highs come Sept. Mind you, this is not me trying to predict the future (besides my crystal ball is in the shop), this is a series of patterns gold has made, that may or may not pan out this time around but CERTAINLY MUST be something we keep our eyes peeled for in the coming months, especially after a slightly parabolic rise like gold just had. The same things occurred after the last 2 slightly parabolic rises we had; first hitting 1225, and on our first crack of 1000.


I have included the 30 year gold chart for 2 reasons: To show that these series of patterns have unfolded in gold in both the short term and very long term, and to move on the the second part of this article in which we will try and anticipate what the future may hold for silver. Below is the 34 year silver chart as well. Notice anything similar between it and gold? If silver were to consolidate from here in a similar manner as gold did for that 18 month period in 08-09 (the battle for 1000), the formation it would form would be virtually identical to that of gold's, just 2 years behind. This would provide a target upon a break of $50/oz of almost $100/oz! Just think of what this will mean for the silver miners who's costs average less than $10/oz! (And there you go, that's all you need to know to be a silver miner analyst. Now spruce up that resume of yours and apply for that job at Goldman.)


I don't believe in coincidences. I don't think it was a coincidence silver got back to its "Hunt brothers manipulation high". I don't believe it was a coincidence it's chart formation is beginning to unfold identically to gold's. I don't believe it's a coincidence these formations keep appearing. I DO believe this could leave us an opportunity to know the future for silver by looking at gold, and I DO believe gold will most likely fall into it's familiar formations again and again as the bull market continues. I DO believe if this is the case, it presents us with great opportunity. I'm not a psychic (well, on weekends.). I prefer to let the market show me what it wants to do, but if your not looking for it, you may never see it. Let's keep our eyes peeled for what comes of this.

Friday, February 4, 2011

Who's telling the right story about the gold market?

In the past few weeks, a lot of people have come out of the wood work voicing their opinions on gold and where it is headed. They state their opinions as if they are commonly known facts that simply have no choice but to be true. For most of them, this is not their first time doing so, stepping out calling an end to the gold bubble when it seems as if it's safe for the bears to come out and play. Most of them have been in this business for quite a long time. Most of them have been in it longer than I. Most are much more renowned investors than myself, and most of them are wrong.

There are a lot of people I listen to on their market analysis, but simply for their interpretations of market action. There will always be things that occur that you didn't think of, this is why it is good to hear another's side of the story. But there is no need to ask anyone what the market is doing. The market will tell you! You just need to listen to it! The common opinion in the gold camp these days is that we will have a drop to about $1250-1225 area where we will be able to find the strongest support. The other opinion is that we are due for a test of the 200 day MA, which stands only about 2% higher than that 1250 support point. Why would we have a test of the 200 day MA? Well, because doing so is simply natural in markets, and anyone who doesn't understand gold, would think that this is inevitable. My friends, gold has not tested the 200 day MA in 2 years! I am of course not ignorant enough to think that it never will, but that alone should tell you something. This market has showed us bottom/top callers of all sorts that come out on gold's natural and healthy (although sometimes violent) corrections to participate in the signing of the metal's death certificate. The consensus is almost never seen. When looking at gold's correction in Dec '09, after reaching $1225/oz, the consensus, the logic, was for it to fall to a strong support point of around $1000/oz (which again was also within about 1.5% of the 200 day MA). It didn't. Instead it stopped about 4% above that point and made everyone who was looking for that "sweet spot", chase the price up higher for all of us that were buying on the way down to it.

There is though a point that gold has corrected to, that has been a bottoming point for the metal in each significant correction within the past 2 years. The only thing you needed to do to find it, is let the market show you. Below is a weekly chart of gold. The technical indicators provided are RSI (14), MACD (12,26,9) Slow Stochastics (14, 3) as well as The 200 week MA, the 50 week MA and the 30 week MA. This is pretty standard stuff to find on any given chart, other than the 30 week MA . I honestly can't think of a single person off the top of my head who pays attention to the 30 week MA on anything. So why did I put it there? Because the gold market was saying something! In the last 2 years gold has tested the 30 week MA 7 times and held every one! Not only did it hold each test, buying at the 30 week MA was buying at the absolute bottom of every significant correction! Anyone who bought gold based on that rule alone, made money every single time.

Of course we will not buy based on one thing alone, so let's look at the rest of the technical picture gold has painted for us to see. You can notice at the top, that each one of those bottoms, those tests of the 30 week MA has coincided with a bottom in RSI at roughly the 50 mark. Look at where RSI stands right now as we close out this week. 54.89 and beginning to turn upwards. Looking at the slow stochastics we can see that it is flattening and ready to turn upwards again at roughly the exact same level it was at the bottom of the correction this time last year. MACD, which has deviated quite a bit from the MA, which has typically depicted a bottom when looked at it in conjunction with the other indicators. Now, you take all that with the fact that gold stopped dead right upon the 30 week MA, sprinkle on some extremely low bullish sentiment, and viola! You have the makings for one sweet, golden, money-making rally!

I don't often write many articles but with the jibber-jabber that we have seen circling gold recently, I felt compelled to do so. I do not want to see people get discouraged and possibly sell out of their gold positions before a massive rally, because they took some half witted trader or reporter's word as gospel when they were most likely just talking their own book to begin with. There is VALUE in gold at these levels. There is value in silver as well. The best value perhaps is in the gold and silver shares. Looking at a weekly chart of the HUI index one can see the same things occur as in the above gold chart. The 50 week MA in gold shares applies the same as the 30 week does in the metal. The same situations in all indicators are right there screaming to you as well.


This market is speaking to us. All we need to do is cut out the chatter and listen to what IT is telling us.