There are a lot of people I listen to on their market analysis, but simply for their interpretations of market action. There will always be things that occur that you didn't think of, this is why it is good to hear another's side of the story. But there is no need to ask anyone what the market is doing. The market will tell you! You just need to listen to it! The common opinion in the gold camp these days is that we will have a drop to about $1250-1225 area where we will be able to find the strongest support. The other opinion is that we are due for a test of the 200 day MA, which stands only about 2% higher than that 1250 support point. Why would we have a test of the 200 day MA? Well, because doing so is simply natural in markets, and anyone who doesn't understand gold, would think that this is inevitable. My friends, gold has not tested the 200 day MA in 2 years! I am of course not ignorant enough to think that it never will, but that alone should tell you something. This market has showed us bottom/top callers of all sorts that come out on gold's natural and healthy (although sometimes violent) corrections to participate in the signing of the metal's death certificate. The consensus is almost never seen. When looking at gold's correction in Dec '09, after reaching $1225/oz, the consensus, the logic, was for it to fall to a strong support point of around $1000/oz (which again was also within about 1.5% of the 200 day MA). It didn't. Instead it stopped about 4% above that point and made everyone who was looking for that "sweet spot", chase the price up higher for all of us that were buying on the way down to it.
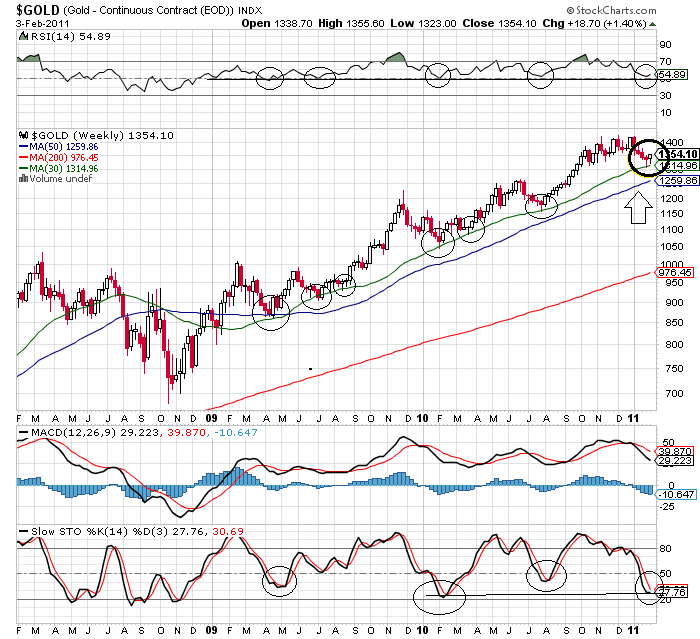
Of course we will not buy based on one thing alone, so let's look at the rest of the technical picture gold has painted for us to see. You can notice at the top, that each one of those bottoms, those tests of the 30 week MA has coincided with a bottom in RSI at roughly the 50 mark. Look at where RSI stands right now as we close out this week. 54.89 and beginning to turn upwards. Looking at the slow stochastics we can see that it is flattening and ready to turn upwards again at roughly the exact same level it was at the bottom of the correction this time last year. MACD, which has deviated quite a bit from the MA, which has typically depicted a bottom when looked at it in conjunction with the other indicators. Now, you take all that with the fact that gold stopped dead right upon the 30 week MA, sprinkle on some extremely low bullish sentiment, and viola! You have the makings for one sweet, golden, money-making rally!


No comments:
Post a Comment